
CropSense Crop Monitoring

Know how every field is doing, without walking it.

CropSense watches every one of your fields from space and shows you where the crop is healthy, where it is struggling and what the weather is about to do, so you act before the yield is lost.

40,000+
Hectares monitored
62+
Crops supported
8+
Vegetation indices
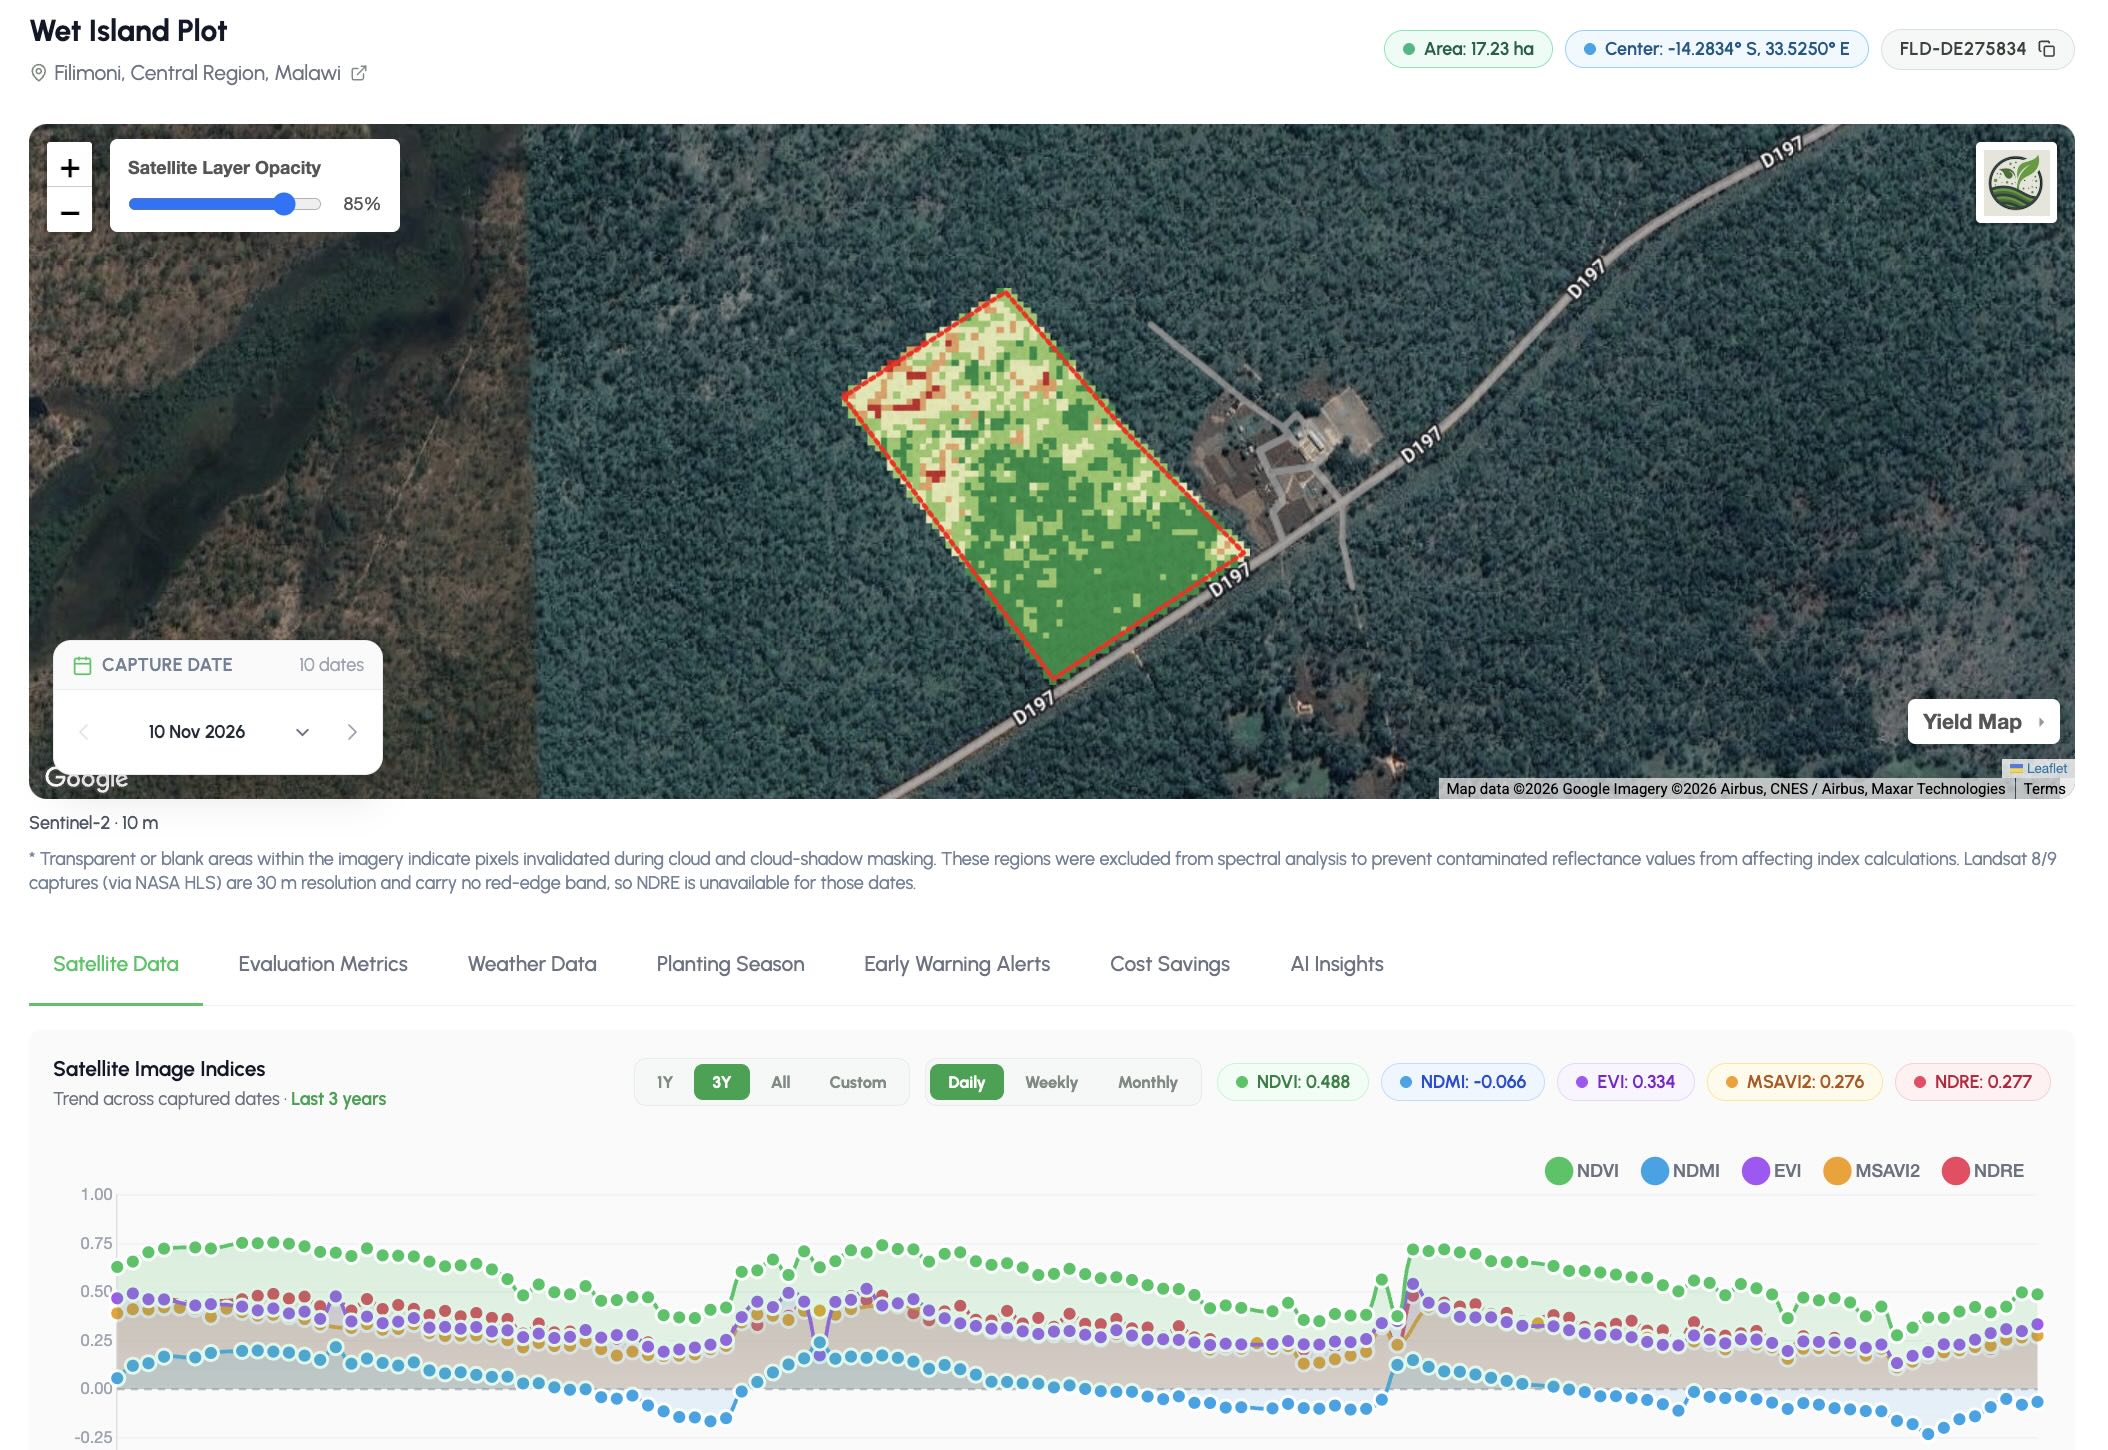
CropSense Crop Monitor showing a farm in Malawi with its NDVI health map over satellite imagery and a three-year chart of five vegetation indices

Everything Happening on the Field, in One View

Every field tells its story through land, crop and weather. CropSense reads all three to catch problems early.

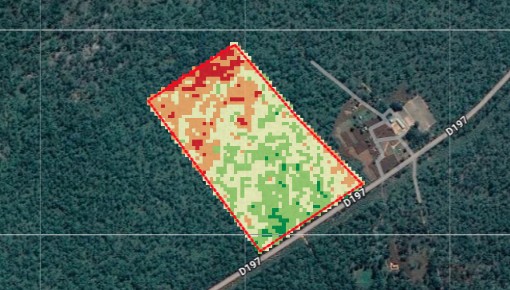
NDVI health map of a field with weaker red and orange zones at one end and healthy green zones elsewhere
18.46 haSoil fertility: moderate
Low High

Field Intelligence

See which part of the field is in trouble.

Map a field once and CropSense builds its record: size, soil and a health map that shows the weak zones inside it, refreshed with every new image.

  • Health maps that pinpoint weak zones, not just a field average
  • Soil data for every field, including iSDA soil maps
  • Season-on-season history for the same boundary
  • Field area and location verified from satellite
Maize Planted 15 May
  1. Planting
  2. Emergence
  3. Vegetative
  4. Tasselling
  5. Maturity
85 / 100Health score
4.5 t/haExpected yield

Crop Intelligence

Follow the crop from planting to harvest.

CropSense tracks each crop’s growth stage from its planting date and updates its health, stress and expected yield with every new image, for more than 62 crops.

  • Health and stress scores from 8+ vegetation indices
  • Growth stages tracked against the planting date
  • Early signs of water and nitrogen stress
  • Season-ahead yield forecasts that update as the crop grows
Field forecast Kaduna North
  • Thu34°0 mm
  • Fri35°0 mm
  • Sat33°0 mm
  • Sun32°1 mm
  • Mon29°14 mm
Dry spell: 4 days with no useful rain during tasselling.

Climate Intelligence

Weather for the field, not the nearest city.

Forecasts, weather history and early warnings for each field’s exact location, with radar that keeps watching through the cloudy rainy season.

  • Field-level forecasts and weather history
  • Early warnings for drought, flooding, heat and pests
  • Radar imagery that keeps watching through cloud
  • Alerts on WhatsApp in 7 languages

Field Alert to Action

Case study: a dry spell threatened a maize farm in Kura, Kano State. Here’s how one CropSense alert saved the harvest.

  1. Stress zone, 1.4 ha
    Maize, 6.2 ha, tasselling
    1. Detected

    Stress spotted in one corner

    The latest satellite image shows leaf moisture falling across 1.4 ha in the north-east corner while the rest of the field stays healthy. No rain is due for six days, right at tasselling.

  2. CropSense AdvisorySent in Hausa, shown in English
    Malam Sani, the north-east corner of your maize (about 1.4 ha) is short of water, and no rain is expected for 6 days.

    Irrigate that corner within 2 days and check the canal inlet on that side.07:42
    Na gode. I will open the canal today.08:15
    2. Delivered

    Advice on WhatsApp, in Hausa

    The farmer gets the alert the same morning, in plain language: where the problem is, why it matters now and the one thing to do about it.

  3. Health score, stress zone53 78
    Dry spell 406080100 Irrigated 19 Aug 1 Aug18 Aug1 Sep20 Sep
    3. Recovered

    Crop back on track in ten days

    The farmer irrigates the next day. Ten days later the corner’s health score is back from 53 to 78, and the field’s expected yield holds at 4.3 t/ha.

The Foundation for Every CropSense Product

Crop Monitoring builds the live record of every field. Advisory, credit, insurance and payments all read from it, so one map opens every door.

Crop MonitoringThe live record of every field
  • Field boundaries
  • Crop health history
  • Growth stages
  • Field weather
  • Farm activity

Crop Monitoring API

Bring field-level satellite intelligence into your own farm management, lending or supply-chain platform without building your own earth observation pipeline.

Register Fields, Pull Indices, Receive Alerts

Create farms and fields from your existing records, then read health indices, weather and early warning alerts for any field, all through the same API as YieldRank and YieldSecure.

  • POST /fields/create

    Register a field boundary on a farm so CropSense starts monitoring it.

  • GET /satellite-images/historical-health-indices/{field_id}

    Retrieve the field’s index time series for season timelines and analysis.

  • GET /weathers/field/{field_id}/forecast

    Get the weather forecast for a field’s exact location.

  • GET /early-warning-alerts/field/{field_id}

    List active early warning alerts for a field.

GET /satellite-images/historical-health-indices/{field_id}
// Response  200 OK (abridged)
{
  "total": 24,
  "indices": [
    {
      "date": "2026-06-10",
      "captured_at": "2026-06-10T09:31:00Z",
      "cloud_coverage_pct": 4.2,
      "ndvi": 0.66,
      "ndmi": 0.28,
      "evi": 0.44,
      "health_score": 79.6,
      "stress_level": 24.1
    },
    {
      "date": "2026-06-15",
      "captured_at": "2026-06-15T09:30:00Z",
      "cloud_coverage_pct": 1.5,
      "ndvi": 0.71,
      "ndmi": 0.32,
      "evi": 0.48,
      "health_score": 85.2,
      "stress_level": 18.4
    },
    // ...
  ]
}

Authentication, the full response schema and every endpoint are documented in the Developer API reference.

Who Crop Monitoring Serves

From a single smallholding to a national loan book, everyone reads the same field record. Each role just sees it the way they need it.

Draw your field. See how your crop is doing in minutes.